KIM Jonghoon Semester-end Project
CityU Noise Pollution Map
Noise pollution is a heavy social issue that imposes detrimental effects to millions of people both mentally and physically. Noise pollution is defined as unwanted or disturbing sound in the environment that affects health and well-being of humans and other living organisms. (National Geographic) According to Journal of the American College of Cardiology, high noise levels can contribute to cardiovascular and aural effects such as heart failure, stroke, arterial hypertension, and hearing loss. Furthermore, nighttime noises are said to increase levels of stress, which is especially crucial for students. As noises are mostly produced by human activities, we are exposed to such noise pollution on a daily basis. Despite such potential threat that it gives to humans, majority of people take noise pollution lightly, simply because we are used to our environmental noise, or we are too busy with our lives to care. Through my semester-end project, I aimed to produce a noise pollution map of City University of Hong Kong along with 360-video and ambisonics recordings, to raise awareness of our exposure to noise pollution. I purposely chose to record in CityU due to its traits of being mostly comprised of young students, where maintaining stress level is especially important.
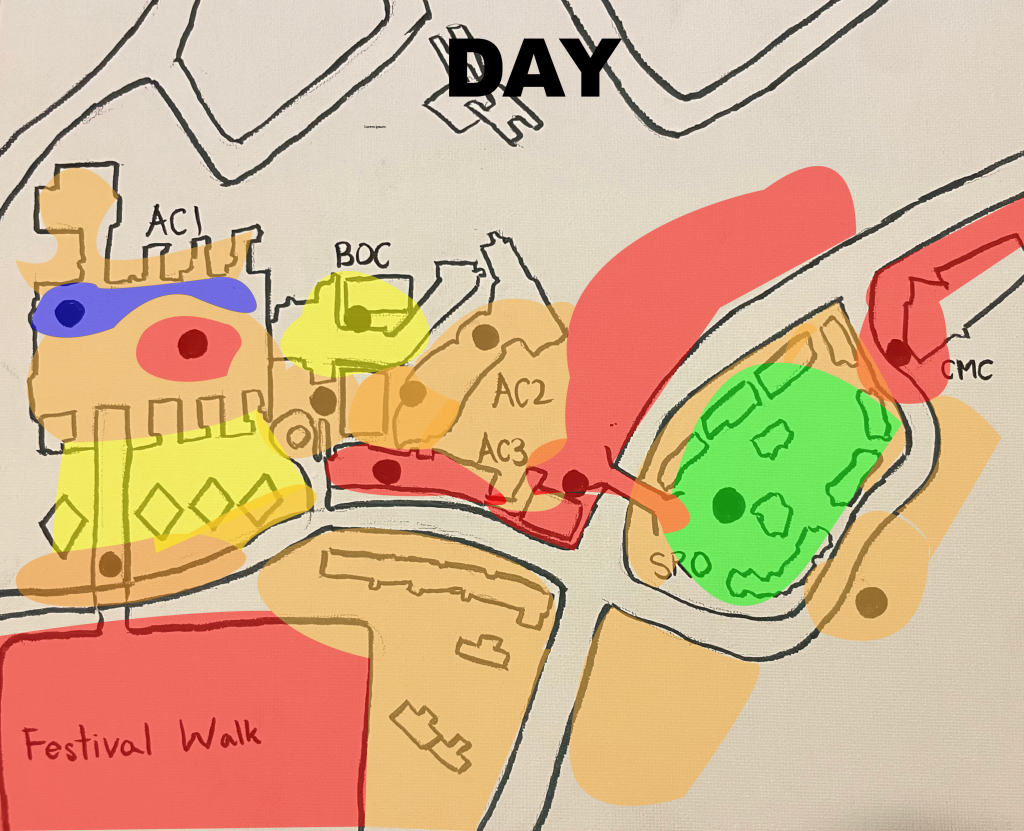
I executed my project by taking 360-videos and recording sounds from multiple locations within CityU such as CMC building, campus main gate, student residence, using both Ricoh Theta Z1 and Zoom H3 in ambisonics format attached to the same tripod. I decided to incorporate 360-video for this project, because VR video would enable the viewer to recognize the sound source in a wider perspective. Time is also a primary variable that determines the environmental noise. For instance, construction noises would be mainly heard during the days whereas transportation noises would be mainly heard during nights due to reduction of human activities. As a result, I recorded twice and created two separate noise pollution maps: one for during the day and the other for during the night. To create the noise map, I hand drew the basic campus on a blank canvas and dotted the specific locations that I recorded. Then, I imported my drawing to Adobe Illustrator to add circular shapes depicting the noise level. As can be seen in Appendix 1, there are 5 sets of colors where each color symbolizes the noise level that can be heard from a specific geographical location. The red, orange, yellow, green, and blue symbolizes very high, high, medium, low, and very low-level noise, respectively. I assigned these colors based on the decibel levels shown in Premiere Pro and my personal perception that I obtained from listening through Shure headphones while recording. With the combination of 360-video and noise pollution map, the listener can indulge himself/herself to the specific environment while realizing the noise level through the map.
Nowadays, noise pollution is neglected and regarded as light disturbance, regardless of its harm towards people. The current bitter reality of noise pollution perception makes my project significant. My final video with ambisonics includes 12 specific locations within the campus. The video starts off with the main campus entrance and ends with CMC, so the viewer can have a virtual tour while being aware of the sound sources that cause noise pollution. Furthermore, I was able to develop this project from mid-semester project, by utilizing 360-video. My mid-semester project was to portray lives within Tung Chua Street Park. However, I realized that there were limitations in fully depicting Tung Chau Street Park with merely photos. Unlike my previous work, the viewer is able to physically view the location in 360 degrees, augmenting the spatial cognition. The successful achievement of completing this project in a developed manner makes myself proud, and I am glad that I was able to fully understand and utilize concepts covered throughout the course through this project.